

Getting started
To see your first statistics, connect a service, choose its data in a project and wait for a refresh. You can configure automations later.
Screenshots throughout this guide use demonstration data. Project names, dates and metrics in your account will differ.
Registration and documents
Create an account or sign in with your email and password. If you have forgotten your password, use the recovery option on the sign-in page. You can configure other sign-in methods and account protection in Profile.
During registration, read the documents beside the required checkboxes and confirm your agreement. Subscribing to news is optional. If a document changes while you are filling in the form, read and confirm the new version.
Legal documents are also linked at the bottom of application pages. Your consents are available in Profile.
If registration is paused, your entries stay in the open form. Return to the tab later and submit when registration resumes. Existing teams can still add members.
Your first project
- Open Connections and add the service whose data you want to analyse.
- In Projects, select Create project. Enter a name, choose a refresh interval and add sources.
- Review the project and confirm creation.
- On Overview, wait for the refresh result. If a source needs attention, open it in Data and follow the suggested action.
- Open Statistics, choose a period and select the metrics you need.
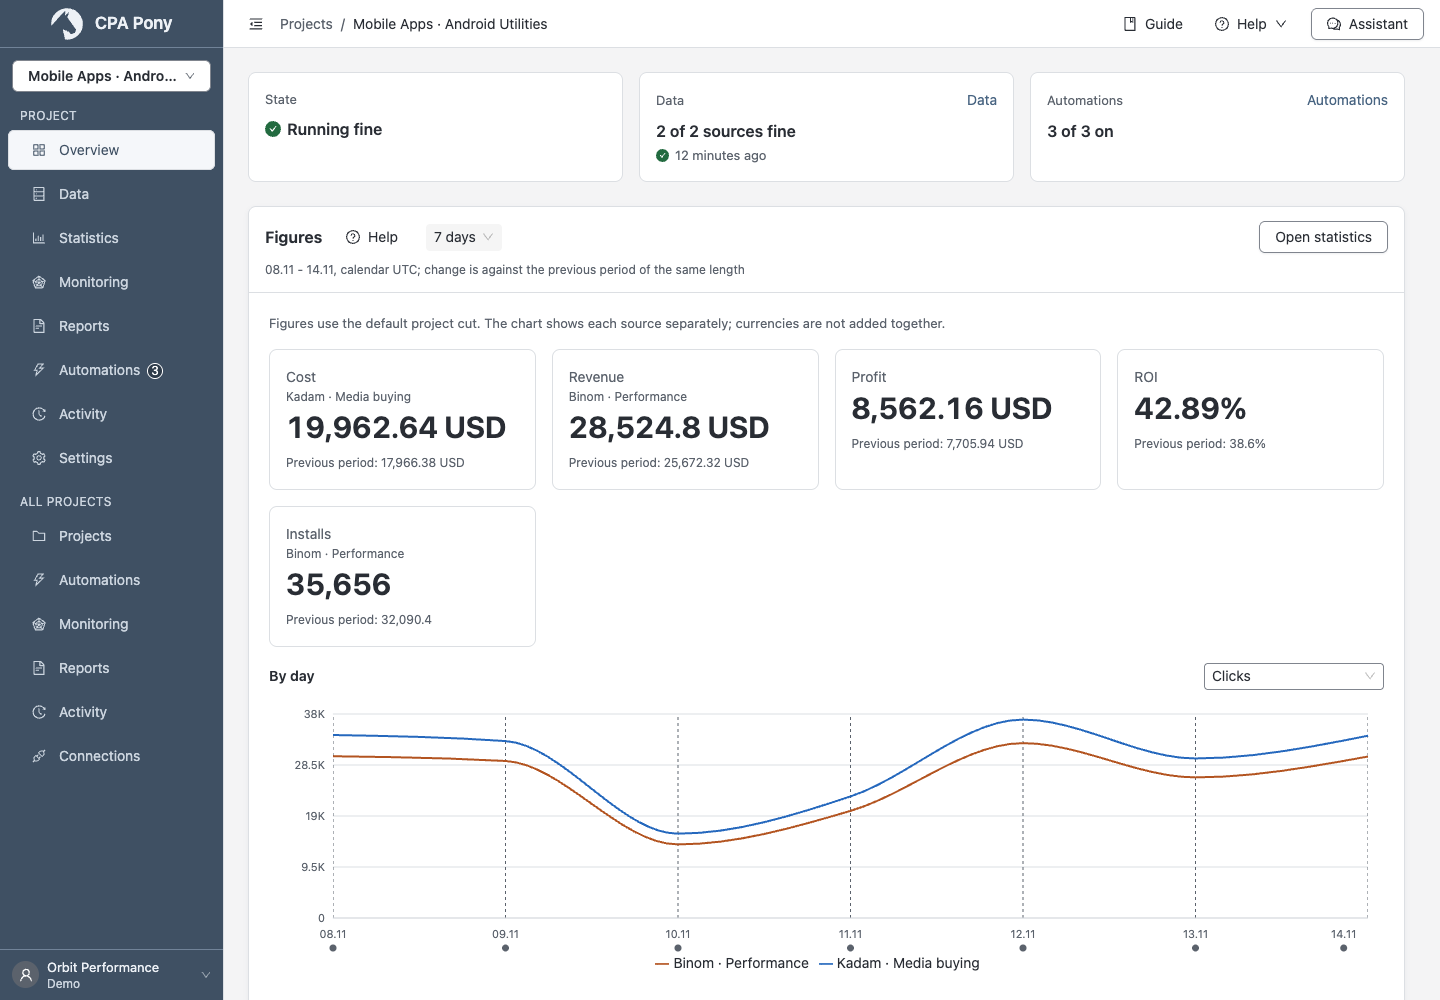
If the table is empty, check the period and data status. An empty table does not necessarily mean a zero result.
Navigate the application
The All projects sections show team data. Select a project in the sidebar to open its Overview, Data, Statistics, Monitoring, Reports, Automations, Activity or Settings. Check the name in the menu to confirm which project you are working with.
Team, Plan and limits, Profile and AI/MCP settings are available from the user menu. On a phone, use the button in the top bar to open the sidebar; scroll wide tables horizontally.
To see released updates, select the version number at the bottom of the application. The Changelog opens in a new tab in your interface language.
Select projects on Home
Choose All projects or individual projects in the selection field, then set a period. The selection applies to the summary metrics, chart and table. Clearing the selection leaves no data until you choose a project or return to All projects.
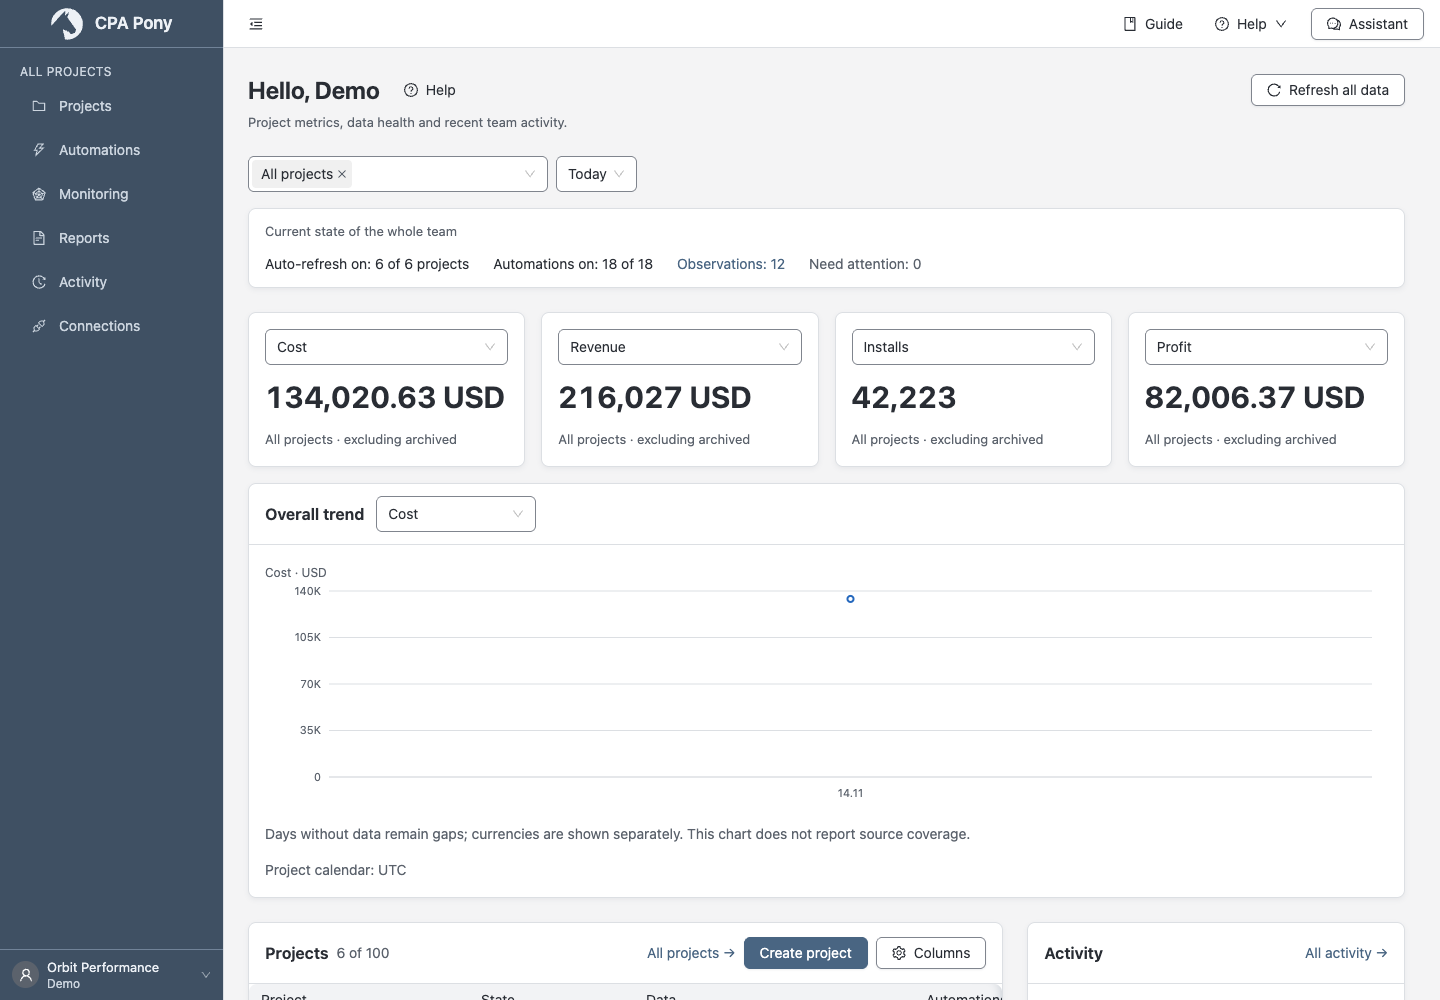
Values in different currencies are not added together. If some projects are excluded, the summary shows their count and the reason. Open a project's Statistics for detailed analysis. If a calculation remains incomplete, shorten the period or select fewer projects.
Language and theme
Open Profile → Interface and choose a language and theme: light, dark or System. The choice is saved in this browser. You can also adjust number formatting there.
Why an action is unavailable
Read the explanation beside the button or message. You may need to fix a connection, configure a source, wait for a refresh or change your plan. If you lack permission, contact your team's owner or administrator.
When a request fails
After a connection failure, previously loaded data and entered values usually remain on the page. An error does not confirm that a save succeeded. Check the result before retrying, especially when an action may have taken effect in an external service.
- If a section did not load, select Retry.
- If a form field is marked, correct it and save again.
- If an object was deleted or access was denied, return to the list or ask an administrator to check your permissions.
- If a waiting time is shown, retry after it ends.
When the application reports maintenance, wait until the indicated time. You do not need to sign in again.
Your manager and help
Guide in the top bar opens instructions for the current section. Help opens the available support contacts. If a manager is assigned to your team, select their name in the top bar to view their contacts.
When contacting support, describe what you tried to do and include the Support reference if one appears beside the error. For a data refresh issue, the Data refresh ID in its status window may also help.
Install as an app
If your browser supports installation, choose its installation command. In Safari, use Add to Dock on Mac or Add to Home Screen on iPhone/iPad. Working with data still requires an internet connection.