

Statistics
Use a project's Statistics to configure a table, compare metrics and export the result. Summary metrics and the trend chart are on the project's Overview.
View a source
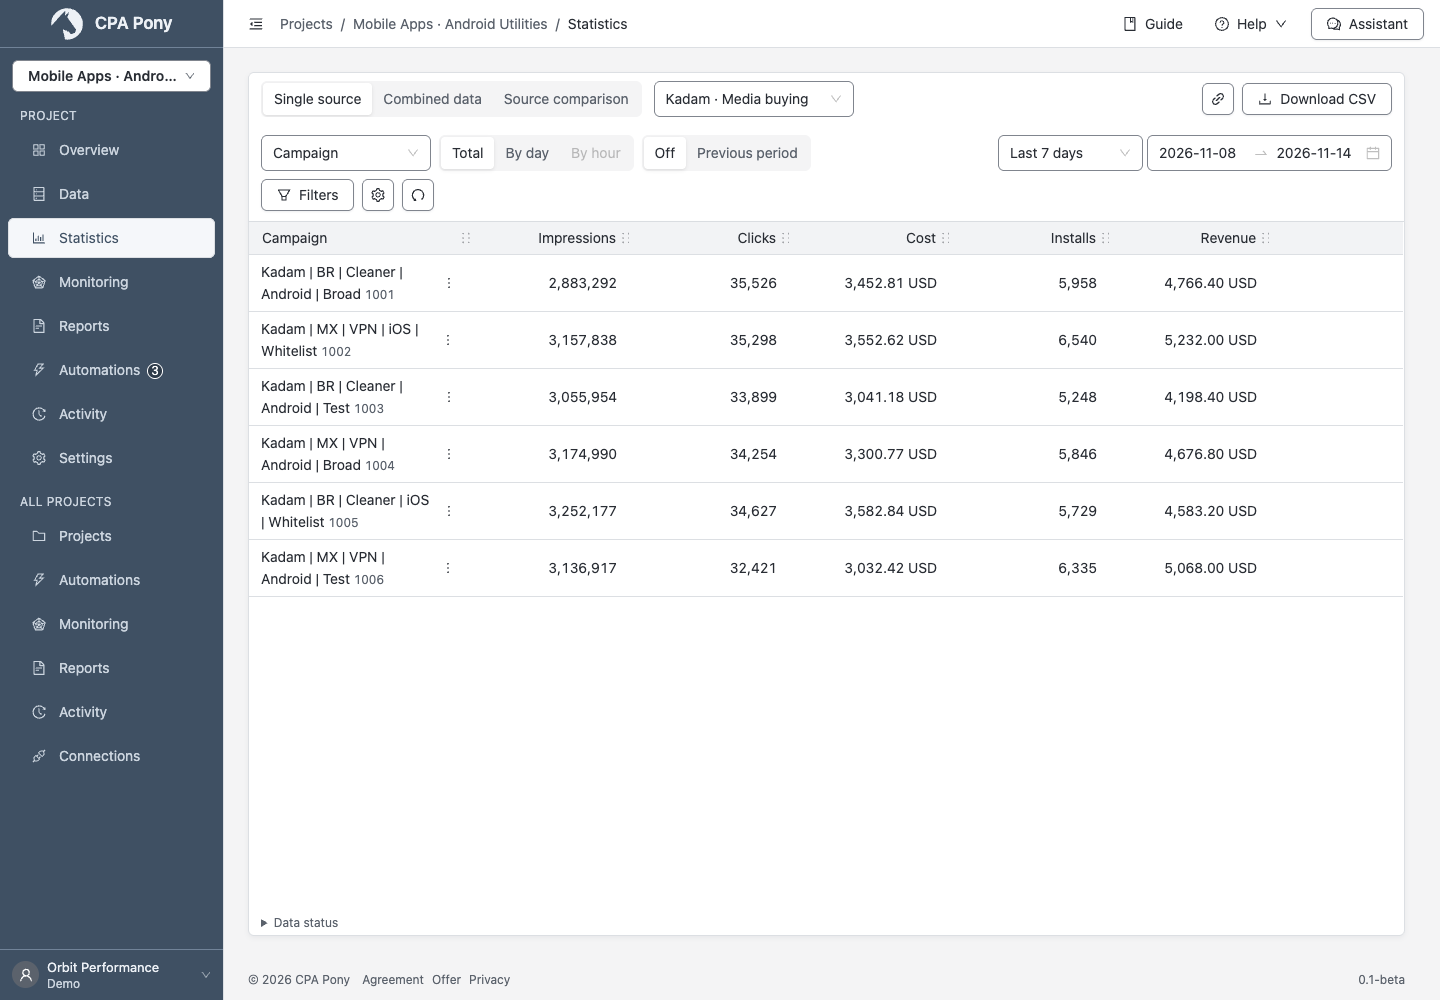
- Select Single source and the connection you need.
- Set a period using a preset or Date range.
- Choose the row dimension, such as campaign or site.
- Choose Total, By day or By hour, where available.
- Open Columns using the gear button and select metrics.
Adjust the table
Select a metric header to sort. Select it again to reverse the direction. Drag a column by its handle to reorder it, or drag its edge to change its width. Columns also lets you choose and order the metrics.
Reset column order and widths restores the current view's layout. Use the page controls and page size below the table to view other rows.
Selecting a column does not enable collection of a new metric. If a metric is not being updated, add it to source metrics first.
Filter and compare
Open Filters, set conditions for objects or metrics, then apply them. Metric conditions apply together. Remove conditions to broaden the selection.
Previous period compares the selected range with the preceding range of the same length. This mode uses period totals and cannot be combined with daily or hourly detail.
Merge data
- Configure source links.
- In Statistics, select Combined data.
- Choose a merge dimension and the columns you need from different sources.
- If the result is incomplete, expand Data status below the table.
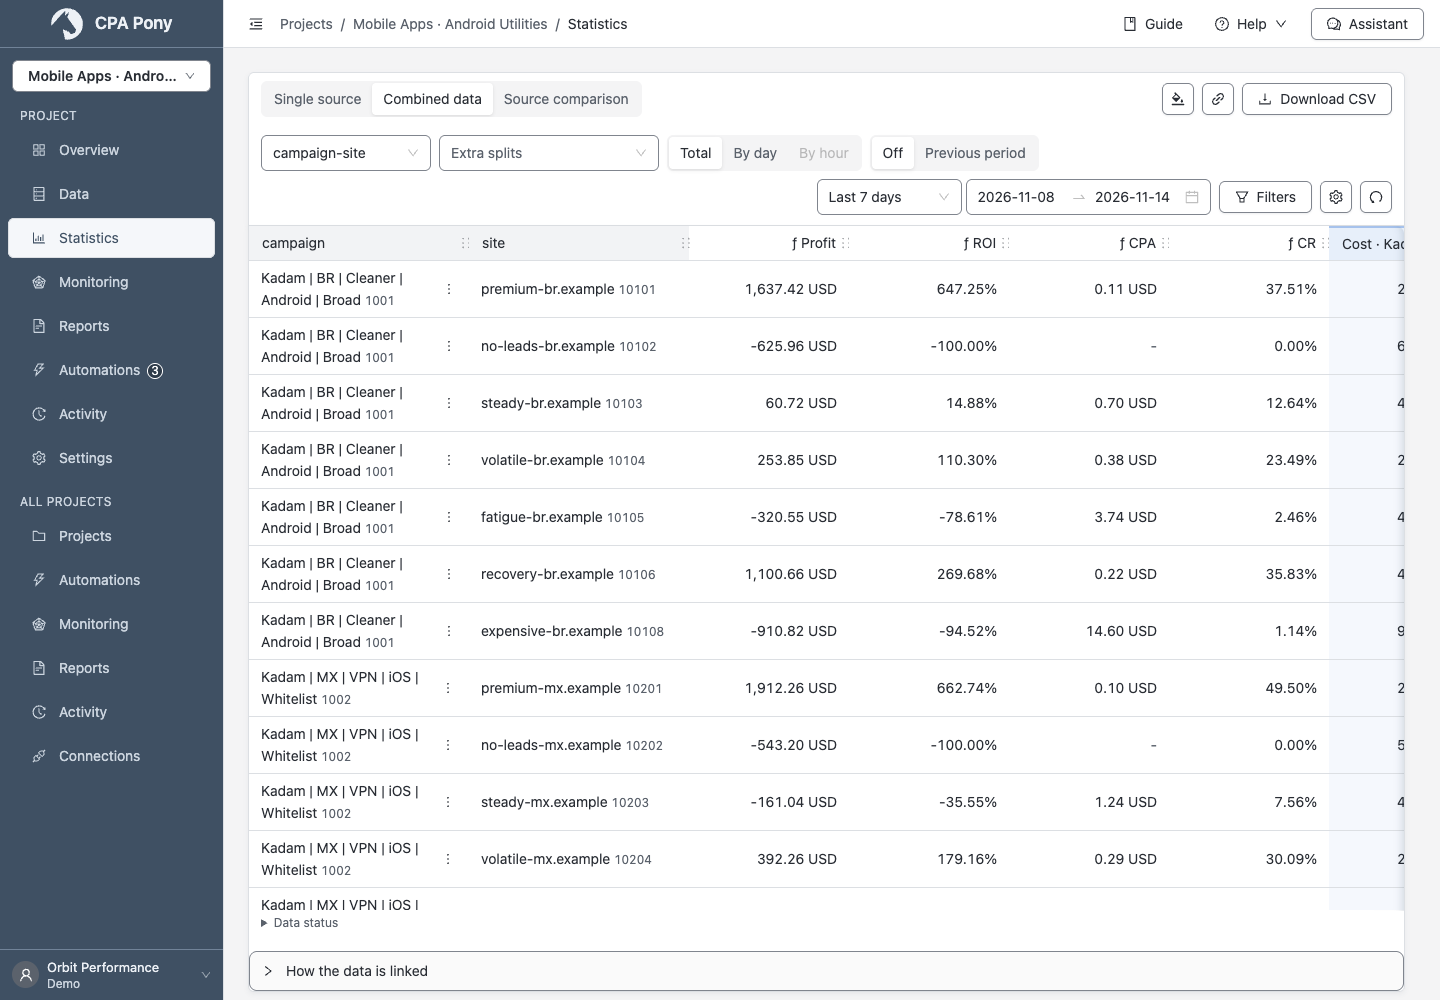
If the selected dimension becomes unavailable, choose another or fix the sources and links. Check filters and sorting after changing the dimension: dependent settings are reset.
For linked sources, the sum of daily values may differ from the period total because matching rows by day can give different matches from matching the whole period.
Compare sources
Select Source comparison, one metric and a comparison base. If needed, filter by discrepancy or keep only common days.
The comparison base is the source used to calculate the discrepancy. Compare metrics with the same meaning and compatible currencies. This mode compares services with each other rather than comparing two periods.
View hourly data
Select By hour. For merged data and source comparison, the required source dimensions must support hourly data. Times use the project's time zone; the period can be up to 744 hours.
If hours are unavailable, check the selected dimension's support and the period. A regular refresh cannot add hourly detail that the service does not provide.
When no data appears
Start with Data status and check the cause:
| What happened | What to do |
|---|---|
| The period is wrong or filters are too narrow | Change the dates or remove some conditions. |
| Data has not been refreshed, or a refresh failed | Check the source in Data and refresh the required period. |
| A new CRM field is not available yet | Select Refresh data, choose a period and confirm. |
| A metric is marked Not updated or Not collected | Select it in the source. For a formula, check all input metrics. Refreshing the period without changing the selection will not help. |
| The merge dimension is unavailable | Restore the dimension in the sources or choose another. |
| The period is outside your plan's history | Choose dates on or after the displayed boundary, or change your plan. |
After adding a metric, values for earlier dates may take a few minutes to appear. A missing value is not zero. An object with no nonzero summable metrics over the period may be absent from the table.
For CRM, use the source's refresh time to check whether a refresh succeeded. Data as of can remain unchanged when the values have not changed.
Coverage of selected data
Coverage helps distinguish gaps from days without events. A day is also covered when the service confirms that it has no data. Full coverage therefore does not necessarily produce table rows.
Coverage applies to the selected dimension and object. Another dimension's data does not fill its gaps; confirmed empty days do not replace coverage of individual hours.
Keep the result
Download CSV exports the current view with its parameters, filters and granularity. The link button copies the view's address. Recipients need to sign in and have access to the project; the link does not make statistics public.
On-screen numbers have at most two decimal places. Rounding settings in Profile only change display; calculations, sorting, filters and CSV use the original values.
If a request fails, follow the error instructions.